We Found Insurance Fraud in Our Crash Data
April 22, 2025
When we set out to build geospatial risk scores for vehicle crashes at Matrisk AI, we never expected that a side by side look at Vehicle Identification Numbers and crash timelines would hint at possible insurance fraud. But data sometimes surprises you. Below, I’ll walk through how we stumbled upon this discovery, what we found, and why it might matter for anyone insuring vehicles.
A curious hunch
Our main focus has been risk scores: Where are crashes most frequent? What are the road conditions? Which stretches of highway see severe outcomes? Yet, a handful of states in our dataset disclose VINs for each crash, and that simple addition changed everything.
Why VINs are a big deal
- They let us track exactly which vehicle is in multiple crashes, not just a vague “car in two accidents.”
- They allow us to approximate when that vehicle might have switched insurance carriers.
- They open the door to spotting suspicious patterns (like the same VIN appearing in an unreasonable cluster of accidents).
I still remember the moment this hit home. Some years ago, a police officer casually told me, “You should get a dashcam, insurance fraud is common around here.” His offhand comment stuck with me, but life moved on. Fast forward to our modern data pipeline, and suddenly those words didn’t seem so casual after all.
Linking crashes together
After filtering out invalid VINs, we narrowed the dataset to roughly ~15 million crashes. (We also removed all drug and alcohol related crashes, since it’s unlikely someone committing insurance fraud would be under the influence.) From there, our pipeline:
- Counts how often the same VIN appears in a short interval (e.g., 6–12 months).
- Flags overlapping or “back to back” insurance coverage for the same VIN.
- Identifies repeated patterns of single vehicle collisions, nighttime crashes, and reported injuries.
We’re not conducting a law enforcement sting, but we do want to spot anomalies that might warrant a closer look.
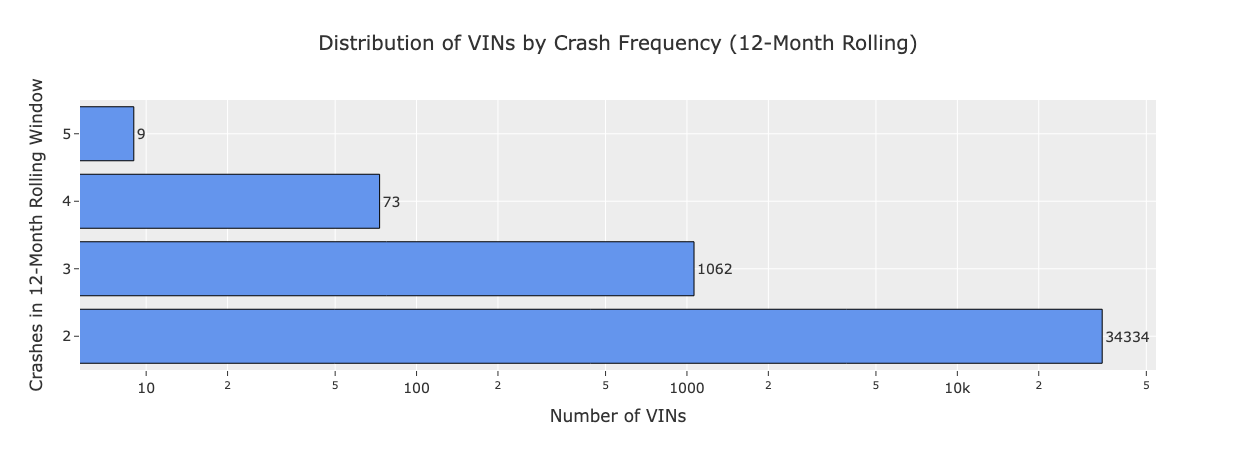 While most VINs have just ≤2 crashes, a subset had ≥5 crashes within a 12-month rolling window.
Suspicious indicators
Industry white papers have pointed out the same red flags time and again. For example, the FBI highlighted a ring in Connecticut where one group of vehicles participated in over 50 staged accidents in just a few years. We’ve found similar signals:
- Multiple crashes: ≥2 accidents involving the same VIN in ≤6 months can raise a red flag.
- Multiple insurers: Switching insurers A → B → C, all in the span of ≤6 months suggests potential “double dipping.”
- Nighttime, no witness collisions: Late night single vehicle accidents with no witnesses are a recurring hallmark of staged accidents.
- Injury Claims: Some fraud rings inflate payouts by reporting injuries.
- Single Vehicle Collisions: Coordinating a crash is simpler when you only involve one vehicle (though multi-vehicle rings exist, too).
We combined these factors into a weighted propensity score to prioritize which VINs were worth a closer inspection. It’s not a definitive fraud meter, just a helpful starting point.
| VIN | Max Crashes (6m) | Max Insurers (6m) | Max Injuries (12m) | Late Night Collisions (12m) | Single-Vehicle Crashes (12m) | Propensity Score |
|---|---|---|---|---|---|---|
| VIN1 | 3 | 3 | 2 | 3 | 3 | 7.6 |
| VIN2 | 3 | 3 | 0 | 0 | 3 | 6.8 |
| VIN3 | 3 | 3 | 0 | 0 | 3 | 6.8 |
| VIN4 | 3 | 2 | 0 | 2 | 3 | 6.5 |
| VIN5 | 3 | 3 | 0 | 1 | 2 | 6.5 |
Insurance switching
Public crash data typically doesn’t provide official coverage start/end dates. As a workaround, we inferred coverage intervals based on the first and last incident listing a particular insurer for a VIN. If two or more such intervals overlapped (or happened back to back within days), we flagged it.
It’s not ironclad evidence of fraud, but seeing multiple carriers handle the same VIN in a tight window definitely raised some eyebrows.
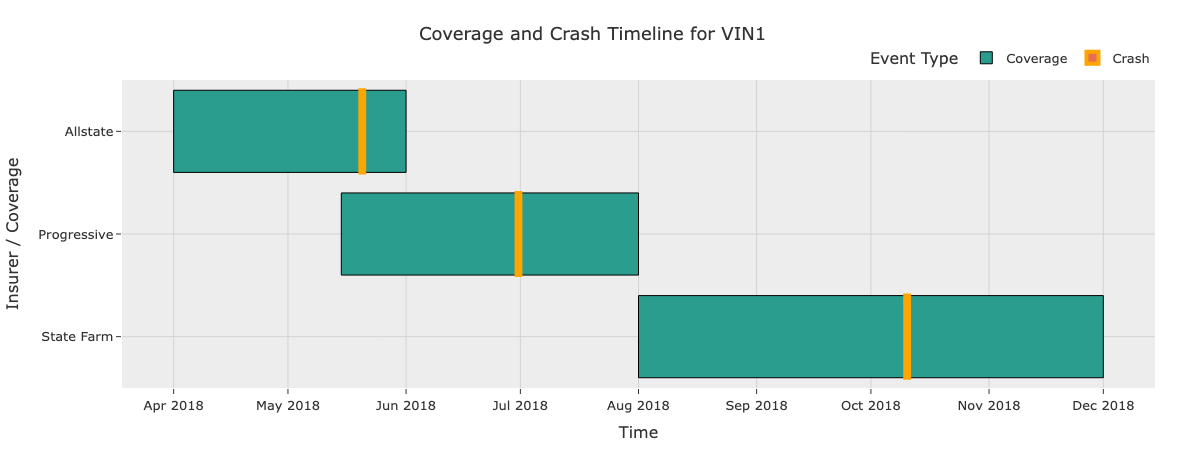 See the overlap? Frequent insurance switching and coverage starting just days before a crash seems almost premeditated.
A deeper look
VIN1 caught our eye, so we stepped through the collision history:
- Short intervals between reported crashes
- 2018-05-20 (late night collision, property damage, single vehicle)
- 2018-06-30 (late night again, minor injury, single vehicle)
- 2018-10-10 (early morning, minor injury, single vehicle)
- Insurance switching
- Allstate covered the first incident. Progressive coverage began just before the first crash and ended after the second crash, at which point State Farm took over.
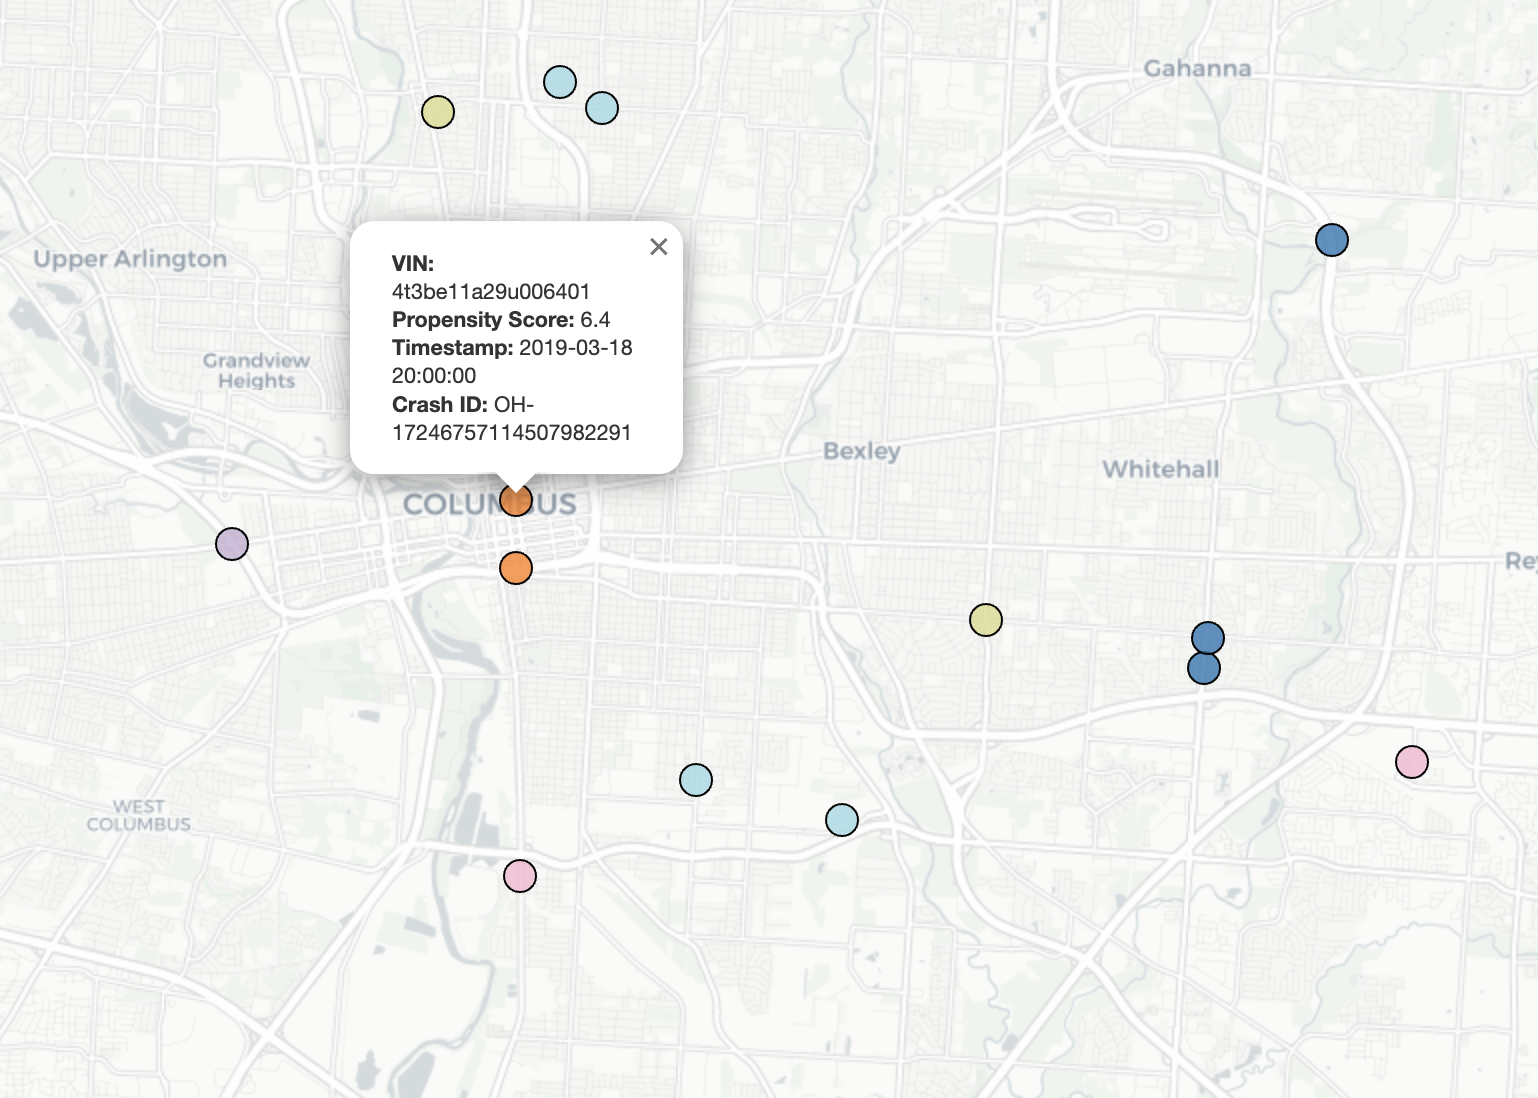
- Suspicious environments
- The collisions happened at times and locations with low traffic and no eyewitnesses.
- Single vehicle collisions
- Each crash was conveniently a single vehicle collision (phantom deer)
Does this prove fraud? Absolutely not. It might be a string of bad luck, or a driver who’s genuinely error prone. But if I were in claims management, I’d be curious to dig further.
Why this matters
Fraud is a tricky subject. By some estimates, fraudulent claims cost the industry billions of dollars each year. We think there’s value in showing how simple VIN analysis, layered with location and insurer data, can highlight “risky” patterns early on.
- For insurers and fleet managers: these insights could guide how you allocate resources to Special Investigations Units (SIUs).
- For risk managers: it’s a reminder that where (and when) an accident happens can be as telling as the crash details themselves.
- For us: it’s simply a fascinating look into how raw data can surface unexpected truths.
 Note: All vehicle and insurance details are anonymized for illustration.
Footnotes
If you’re curious about how we generate our risk scores—or if you just want to compare notes—feel free to reach out to our team. We’d love to hear your thoughts.


