<?xml version="1.0" encoding="utf-8"?><feed xmlns="http://www.w3.org/2005/Atom" ><generator uri="https://jekyllrb.com/" version="3.10.0">Jekyll</generator><link href="https://www.levs.fyi/feed.xml" rel="self" type="application/atom+xml" /><link href="https://www.levs.fyi/" rel="alternate" type="text/html" /><updated>2026-05-19T23:23:52+00:00</updated><id>https://www.levs.fyi/feed.xml</id><title type="html">Lev Ostatnigrosh</title><subtitle>Personal site &amp; blog</subtitle><entry><title type="html">2 Years of ML vs. 1 Month of Prompting</title><link href="https://www.levs.fyi/blog/2-years-of-ml-vs-1-month-of-prompting/" rel="alternate" type="text/html" title="2 Years of ML vs. 1 Month of Prompting" /><published>2025-11-07T00:00:00+00:00</published><updated>2025-11-07T00:00:00+00:00</updated><id>https://www.levs.fyi/blog/2-years-of-ml-vs-1-month-of-prompting</id><content type="html" xml:base="https://www.levs.fyi/blog/2-years-of-ml-vs-1-month-of-prompting/"><![CDATA[<p>Recalls at major automakers cost hundreds of millions of dollars a year. It’s a huge issue. To mitigate it, our company created an analytics department solely focused on categorizing warranty claims into actionable problems.</p>

<p>For decades, this team has relied on SQL queries to classify warranty data. But vehicles—and the language used to describe them—have evolved. SQL struggles with semantics, negations, and contextual nuance. Here’s a fictional example of a claim we might see in the wild:</p>

<blockquote>
  <p><em>“Customer reports oil on driveway, thought engine leak. Detailed inspection found no engine leaks. Traced oil to spill during last oil change. Oil on subframe dripping to ground. Cleaned subframe, verified no leaks from engine or drain plug. Customer advised.”</em></p>
</blockquote>

<p>An oversimplified SQL query that might try and capture this scenario:</p>

<div class="language-sql highlighter-rouge"><div class="highlight"><pre class="highlight"><code><span class="k">SELECT</span>
    <span class="n">claim_id</span><span class="p">,</span>
    <span class="n">claim_text</span><span class="p">,</span>
    <span class="k">CASE</span>
        <span class="k">WHEN</span> <span class="p">(</span>
            <span class="p">(</span><span class="k">LOWER</span><span class="p">(</span><span class="n">claim_text</span><span class="p">)</span> <span class="k">LIKE</span> <span class="s1">'%leak%'</span>
             <span class="k">OR</span> <span class="k">LOWER</span><span class="p">(</span><span class="n">claim_text</span><span class="p">)</span> <span class="k">LIKE</span> <span class="s1">'%leaking%'</span>
             <span class="k">OR</span> <span class="k">LOWER</span><span class="p">(</span><span class="n">claim_text</span><span class="p">)</span> <span class="k">LIKE</span> <span class="s1">'%seep%'</span>
        <span class="k">AND</span>
            <span class="p">(</span><span class="k">LOWER</span><span class="p">(</span><span class="n">claim_text</span><span class="p">)</span> <span class="k">LIKE</span> <span class="s1">'%oil%'</span>
             <span class="k">OR</span> <span class="k">LOWER</span><span class="p">(</span><span class="n">claim_text</span><span class="p">)</span> <span class="k">LIKE</span> <span class="s1">'%fluid%'</span>
        <span class="k">AND</span>
            <span class="k">LOWER</span><span class="p">(</span><span class="n">claim_text</span><span class="p">)</span> <span class="k">NOT</span> <span class="k">LIKE</span> <span class="s1">'%no leak%'</span>
            <span class="k">AND</span> <span class="k">LOWER</span><span class="p">(</span><span class="n">claim_text</span><span class="p">)</span> <span class="k">NOT</span> <span class="k">LIKE</span> <span class="s1">'%not leaking%'</span>
        <span class="p">)</span>
        <span class="k">THEN</span> <span class="mi">1</span>
        <span class="k">ELSE</span> <span class="mi">0</span>
    <span class="k">END</span> <span class="k">AS</span> <span class="n">is_leak</span>
<span class="k">FROM</span> <span class="n">warranty_claims</span><span class="p">;</span>
</code></pre></div></div>

<p>What we can gather from this example is that the leak came from a service oil spill—not the vehicle. Yet this query would still flag it as a leak. In production, these types of queries balloon into hundreds—if not thousands—of similar clauses. Over the years, the team created thousands of classification buckets. Many of these legacy buckets still siphon off claims today—creating unnecessary work for analysts and slowing down the detection of new issues.</p>

<hr />

<h2 id="the-classification-project">The classification project</h2>

<p>In 2023, the company launched a major initiative to automate warranty classification using supervised models. Here’s how that went:</p>

<ol>
  <li>
    <p><strong>Data Collection:</strong> The first challenge was establishing a ground truth. Each team member had different mental models of how claims should be categorized. After months of discussion, the team finally aligned on a set of core “symptoms” to categorize warranty claims by. Then came the hard part: manually labeling thousands of complex claims per symptom—work that only domain experts could handle. After many months we had labeled just half the symptoms.</p>
  </li>
  <li>
    <p><strong>Preprocessing:</strong> Raw warranty text is messy—full of acronyms, error codes, and multilingual input.</p>

    <blockquote>
      <p><em>“cust reports mil on with p0420. tech found a/c compressor clutch noise at idle. checked map sensor, reading normal. replaced cat converter per tsb. dtc cleared, road test ok.”</em></p>

      <p><strong>Translation:</strong> Customer reports a check engine light. Technician found an unrelated AC compressor issue. Catalyst converter was replaced per technical service bulletin. Problem resolved.</p>
    </blockquote>

    <p>We built a 9 stage preprocessing pipeline: text sanitization, concatenation, tokenization, acronym expansion, stop word removal, spell checking, service bulletin extraction, diagnostic code parsing, and translation. That took another 6 months.</p>

    <p>Fun fact: Translating French and Spanish claims into German first improved technical accuracy—an unexpected perk of Germany’s automotive dominance.</p>
  </li>
  <li>
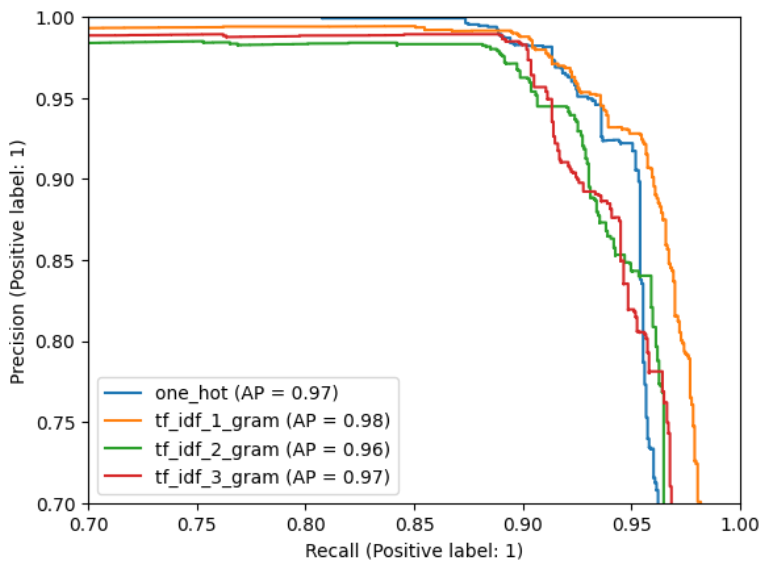
    <p><strong>Modeling:</strong> We tried multiple vectorization and classification approaches. Our data was heavily imbalanced and skewed towards negative cases. We found that TF-IDF with 1-gram features paired with XGBoost consistently emerged as the winner. See the PR curve attached below <a href="#footnotes">[1]</a></p>
  </li>
</ol>

<p>Getting to production was another challenge. Migrating everything to the cloud, building a UI for our analytics team, onboarding vendors, and coordinating with IT—the project stretched across multiple years. Our plan was to deploy the first 10 models, gather real world feedback, and resume labeling for the remaining symptoms. But once the initial batch of classifiers went live, project priorities shifted: the scope expanded to deploying all classifiers, while the team previously helping with annotation had moved on to new initiatives.</p>

<p>We suddenly had a data scarcity problem. How do you deploy models without training data? Even with renewed labeling efforts, it would’ve taken months to label new datasets. We needed a faster, more flexible solution.</p>

<hr />

<h2 id="what-about-large-language-models">What about large language models?</h2>

<p>We actually tried few-shot prompting with GPT-3.5 at the start of this project—but the results were disappointing: low accuracy, high latency, and prohibitive costs. Fast forward two years, and the landscape had radically changed. Modern models were faster, cheaper, and showed strong few-shot performance across various domains. That raised a question: could we get within 5% of our purpose-built classifiers?</p>

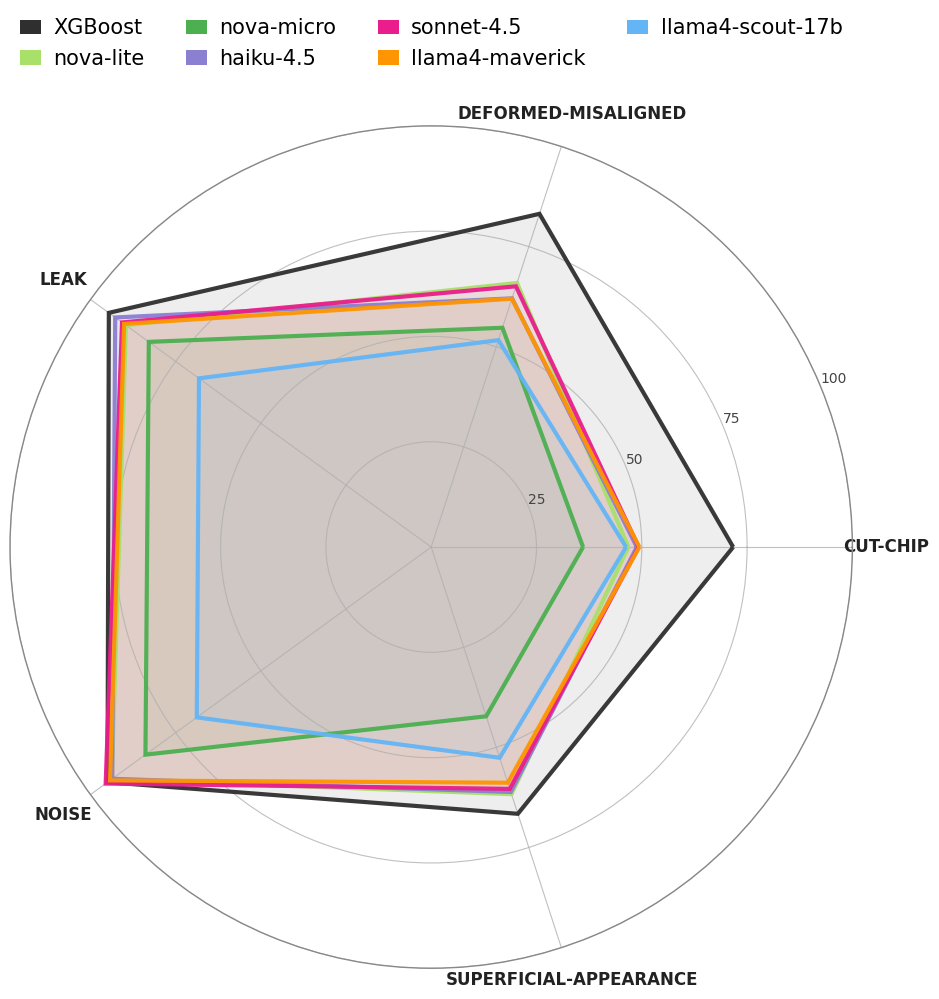
<p>To find out, we benchmarked 6 frontier models against our baseline using 5 labeled datasets ranging from broad symptoms like <em>leak</em> and <em>noise</em> to narrow ones like <em>cut-chip</em>. With our data skewed toward negative cases, we chose <a href="https://en.wikipedia.org/wiki/Receiver_operating_characteristic#Area_under_the_curve">PR AUC</a> as the primary metric, backed by <a href="https://en.wikipedia.org/wiki/Matthews_correlation_coefficient">Matthews Correlation Coefficient (MCC)</a> and <a href="https://en.wikipedia.org/wiki/F-score">F1</a>. The early results? XGBoost still led by ~15% on average, especially on the hardest tasks, though LLMs showed promise in broader categories. (See chart below.)</p>

<p><img src="/assets/blog/warranty_classification/radar_v1.png" alt="Radar chart showing model performance across categories" /></p>

<hr />

<h2 id="closing-the-gap">Closing the gap</h2>

<p>When we factored in cost, Nova Lite was the clear value pick—third best PR AUC score, yet the second cheapest model <a href="#footnotes">[2]</a>. So we pushed forward with it and began iterating on our prompts.</p>

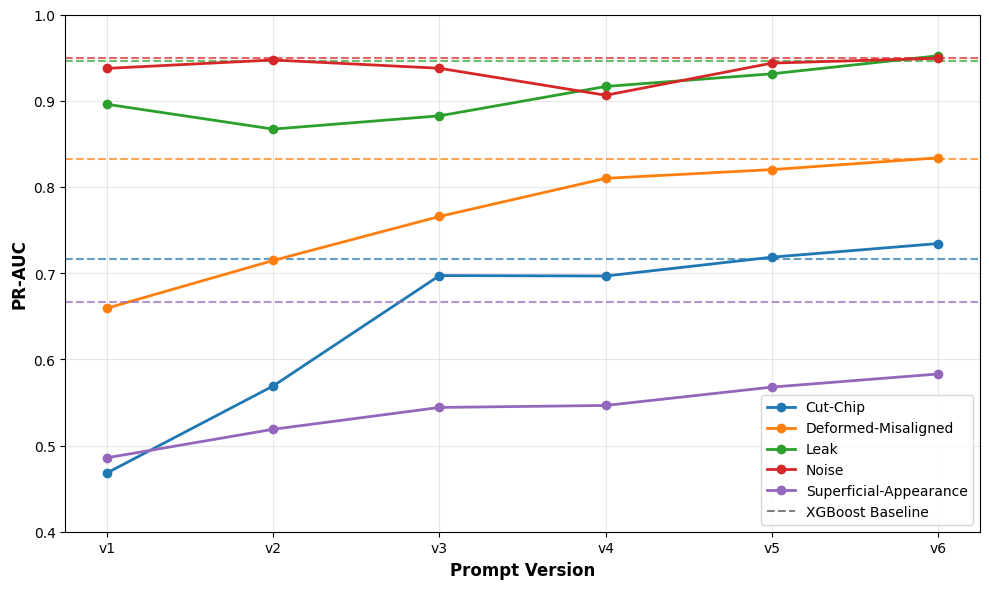
<p>Our prompt tuning combined evaluation with reasoning. For each symptom, we ran Nova Lite on a stratified sample of labeled data, capturing two outputs: the prediction and its reasoning. We compared results to the ground truth, analyzed where prompts failed, and used those reasoning traces to identify gaps. Failure cases and the current prompt were then passed to a larger LLM to generate refinements. Each version was re-evaluated multiple times to confirm accuracy and rule out noise. See the step-by-step progression <a href="#footnotes">[3]</a>.</p>

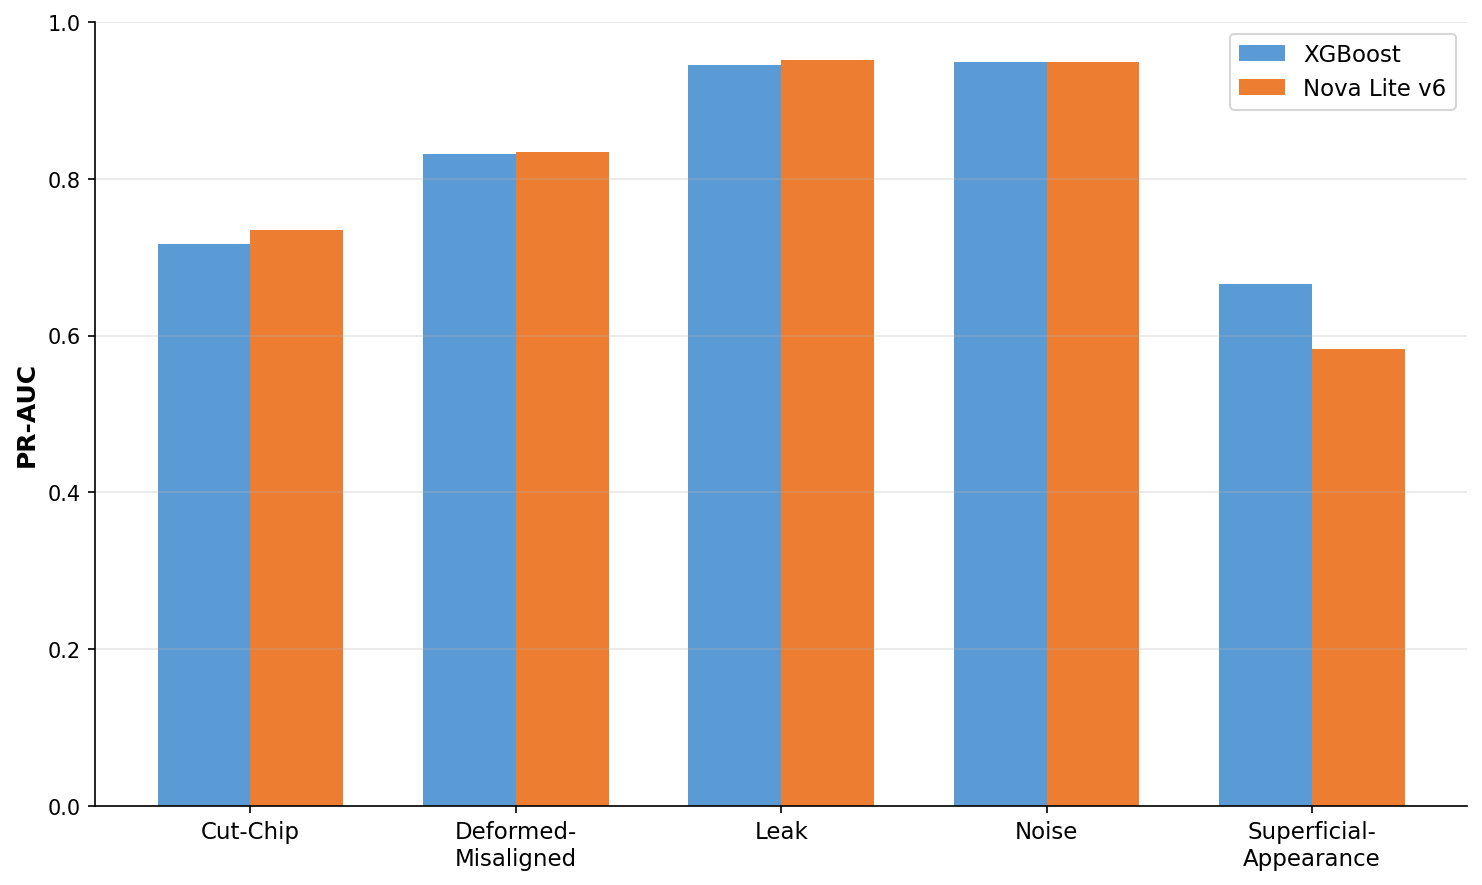
<p>After 6 rounds of refinement, Nova Lite closed the performance gap and matched—or slightly beat—our supervised XGBoost model in 4 of 5 categories (<em>cut-chip, deformed-misaligned,</em> <em>leak</em>, <em>and noise</em>). The biggest leap was <em>cut-chip</em>, which improved 35 points and edged ahead of our baseline. Broader categories like <em>noise</em> and <em>leak</em> started strong and saw only marginal gains. <em>Superficial-appearance</em> remains the exception—still trailing by 12 points, which suggests it may need a different modeling approach entirely.</p>

<p><img src="/assets/blog/warranty_classification/comparison_bar_chart.png" alt="Bar chart comparing XGBoost vs Nova Lite performance" /></p>

<hr />

<h2 id="so-what">So What?</h2>

<p>Over multiple years, we built a supervised pipeline that worked. In 6 rounds of prompting, we matched it. That’s the headline, but it’s not the point. The real shift is that classification is no longer gated by data availability, annotation cycles, or pipeline engineering.</p>

<p>Supervised models still make sense when you have stable targets and millions of labeled samples. But in domains where the taxonomy drifts, the data is scarce, or the requirements shift faster than you can annotate, LLMs turn an impossible backlog into a prompt iteration loop.</p>

<p>We didn’t just replace a model. We replaced a process.</p>

<hr />

<h2 id="footnotes">Footnotes</h2>

<p>[1] PR curve exploring various vectorization methods.</p>

<p><img src="/assets/blog/warranty_classification/pr_curve.png" alt="PR curve showing vectorization methods" /></p>

<p>[2] Price vs. performance table</p>

<table>
  <thead>
    <tr>
      <th>Model</th>
      <th>Cost per 1M tokens</th>
      <th>PR AUC</th>
    </tr>
  </thead>
  <tbody>
    <tr>
      <td>Claude Sonnet 4.5</td>
      <td>$3.00</td>
      <td>0.722</td>
    </tr>
    <tr>
      <td>Claude Haiku 4.5</td>
      <td>$1.00</td>
      <td>0.717</td>
    </tr>
    <tr>
      <td>⭐ <strong>Nova Lite</strong></td>
      <td><strong>$0.06</strong></td>
      <td><strong>0.716</strong></td>
    </tr>
    <tr>
      <td>Llama 3.3 70B</td>
      <td>$0.72</td>
      <td>0.712</td>
    </tr>
    <tr>
      <td>Llama 4 Maverick 17B</td>
      <td>$0.24</td>
      <td>0.709</td>
    </tr>
    <tr>
      <td>Nova Micro</td>
      <td>$0.04</td>
      <td>0.600</td>
    </tr>
    <tr>
      <td>Llama 4 Scout 17B</td>
      <td>$0.17</td>
      <td>0.575</td>
    </tr>
  </tbody>
</table>

<p>** <em>All LLM prices shown are on-demand. Batch pricing is ~50% lower.</em></p>

<p>[3] Prompt by prompt progression</p>

<p><img src="/assets/blog/warranty_classification/prompts.png" alt="Chart showing prompt improvement progression" /></p>]]></content><author><name></name></author><summary type="html"><![CDATA[How we matched years of supervised learning work with 6 rounds of prompt engineering]]></summary></entry><entry><title type="html">We Found Insurance Fraud in Our Crash Data</title><link href="https://www.levs.fyi/blog/we-found-insurance-fraud-in-our-crash-data/" rel="alternate" type="text/html" title="We Found Insurance Fraud in Our Crash Data" /><published>2025-04-22T00:00:00+00:00</published><updated>2025-04-22T00:00:00+00:00</updated><id>https://www.levs.fyi/blog/we-found-insurance-fraud-in-our-crash-data</id><content type="html" xml:base="https://www.levs.fyi/blog/we-found-insurance-fraud-in-our-crash-data/"><![CDATA[<p>When we set out to build geospatial risk scores for vehicle crashes at Matrisk AI, we never expected that a side by side look at  <a href="https://en.wikipedia.org/wiki/Vehicle_identification_number">Vehicle Identification Numbers</a> and crash timelines would hint at <em>possible insurance fraud</em>. But data sometimes surprises you. Below, I’ll walk through how we stumbled upon this discovery, what we found, and why it might matter for anyone insuring vehicles.</p>

<hr />

<h2 id="a-curious-hunch">A curious hunch</h2>

<p>Our main focus has been risk scores: Where are crashes most frequent? What are the road conditions? Which stretches of highway see severe outcomes? Yet, a handful of states in our dataset disclose VINs for each crash, and that simple addition changed everything.</p>

<p><strong>Why VINs are a big deal</strong></p>

<ul>
  <li>They let us track <em>exactly</em> which vehicle is in multiple crashes, not just a vague “car in two accidents.”</li>
  <li>They allow us to approximate when that vehicle might have switched insurance carriers.</li>
  <li>They open the door to spotting suspicious patterns (like the same VIN appearing in an unreasonable cluster of accidents).</li>
</ul>

<p>I still remember the moment this hit home. Some years ago, a police officer casually told me, “You should get a dashcam, insurance fraud is common around here.” His offhand comment stuck with me, but life moved on. Fast forward to our modern data pipeline, and suddenly those words didn’t seem so casual after all.</p>

<hr />

<h2 id="linking-crashes-together">Linking crashes together</h2>

<p>After filtering out invalid VINs, we narrowed the dataset to roughly <em>~15 million crashes</em>. <em>(We also removed all drug and alcohol related crashes, since it’s unlikely someone committing insurance fraud would be under the influence.)</em> From there, our pipeline:</p>

<ol>
  <li>Counts how often the same VIN appears in a short interval (e.g., 6–12 months).</li>
  <li>Flags overlapping or “back to back” insurance coverage for the same VIN.</li>
  <li>Identifies repeated patterns of single vehicle collisions, nighttime crashes, and reported injuries.</li>
</ol>

<p>We’re not conducting a law enforcement sting, but we do want to spot anomalies that might warrant a closer look.</p>

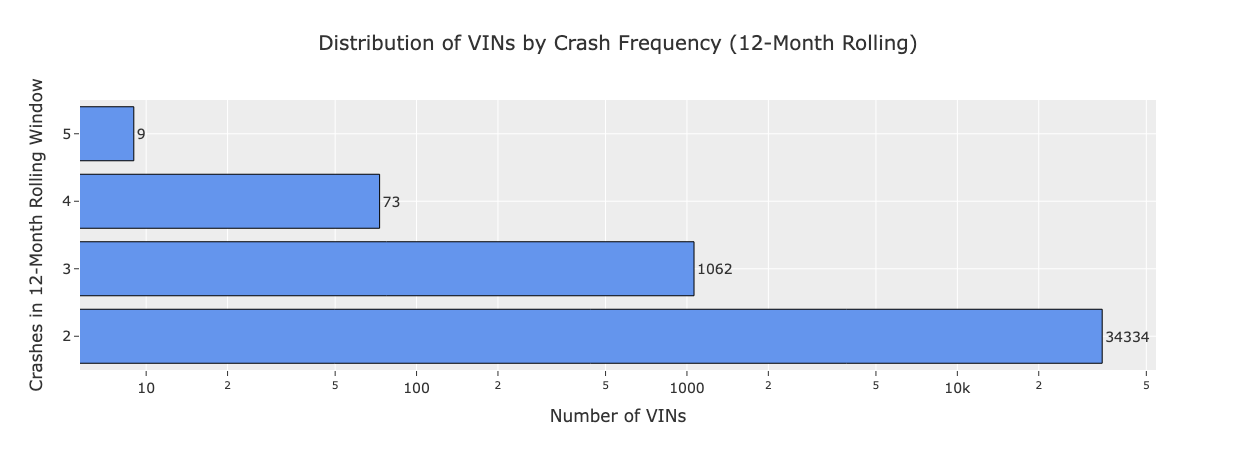
<p><img src="/assets/blog/insurance_fraud/vin_distribution.png" alt="While most VINs have ≤2 crashes, a small subset has ≥5 within 12 months" />
<em>While most VINs have just ≤2 crashes, a subset had ≥5 crashes within a 12-month rolling window.</em></p>
<hr />

<h2 id="suspicious-indicators">Suspicious indicators</h2>

<p>Industry white papers have pointed out the same red flags time and again. For example, the <a href="https://www.fbi.gov/news/stories/staged-accident-ring">FBI highlighted</a> a ring in Connecticut where one group of vehicles participated in over 50 staged accidents in just a few years. We’ve found similar signals:</p>

<ul>
  <li><strong>Multiple crashes:</strong> <em>≥2</em> accidents involving the same VIN in <em>≤6</em> months can raise a red flag.</li>
  <li><strong>Multiple insurers:</strong> Switching insurers <em>A → B → C</em>, all in the span of <em>≤6</em> months suggests potential “double dipping.”</li>
  <li><strong>Nighttime, no witness collisions:</strong> Late night single vehicle accidents with no witnesses are a recurring hallmark of <a href="https://www.insure.com/car-insurance/suspicious-loss-indicators.html#:~:text=,or%20replacement%20of%20covered%20property">staged accidents</a>.</li>
  <li><strong>Injury Claims:</strong> Some fraud rings inflate payouts by reporting injuries.</li>
  <li><strong>Single Vehicle Collisions:</strong> Coordinating a crash is simpler when you only involve one vehicle (though multi-vehicle rings exist, too).</li>
</ul>

<p>We combined these factors into a weighted <a href="https://www.sas.com/content/dam/SAS/bp_de/doc/whitepaper1/ri-wp-combating-insurance-claims-fraud-1925585.pdf#:~:text=damage%20for%20the%20nature%20of,flagged%20if"><em>propensity score</em></a> to prioritize which VINs were worth a closer inspection. It’s not a definitive fraud meter, just a helpful starting point.</p>

<table>
  <thead>
    <tr>
      <th><strong>VIN</strong></th>
      <th><strong>Max Crashes (6m)</strong></th>
      <th><strong>Max Insurers (6m)</strong></th>
      <th><strong>Max Injuries (12m)</strong></th>
      <th><strong>Late Night Collisions (12m)</strong></th>
      <th><strong>Single-Vehicle Crashes (12m)</strong></th>
      <th><strong>Propensity Score</strong></th>
    </tr>
  </thead>
  <tbody>
    <tr>
      <td>VIN1</td>
      <td>3</td>
      <td>3</td>
      <td>2</td>
      <td>3</td>
      <td>3</td>
      <td>7.6</td>
    </tr>
    <tr>
      <td>VIN2</td>
      <td>3</td>
      <td>3</td>
      <td>0</td>
      <td>0</td>
      <td>3</td>
      <td>6.8</td>
    </tr>
    <tr>
      <td>VIN3</td>
      <td>3</td>
      <td>3</td>
      <td>0</td>
      <td>0</td>
      <td>3</td>
      <td>6.8</td>
    </tr>
    <tr>
      <td>VIN4</td>
      <td>3</td>
      <td>2</td>
      <td>0</td>
      <td>2</td>
      <td>3</td>
      <td>6.5</td>
    </tr>
    <tr>
      <td>VIN5</td>
      <td>3</td>
      <td>3</td>
      <td>0</td>
      <td>1</td>
      <td>2</td>
      <td>6.5</td>
    </tr>
  </tbody>
</table>

<hr />

<h2 id="insurance-switching">Insurance switching</h2>

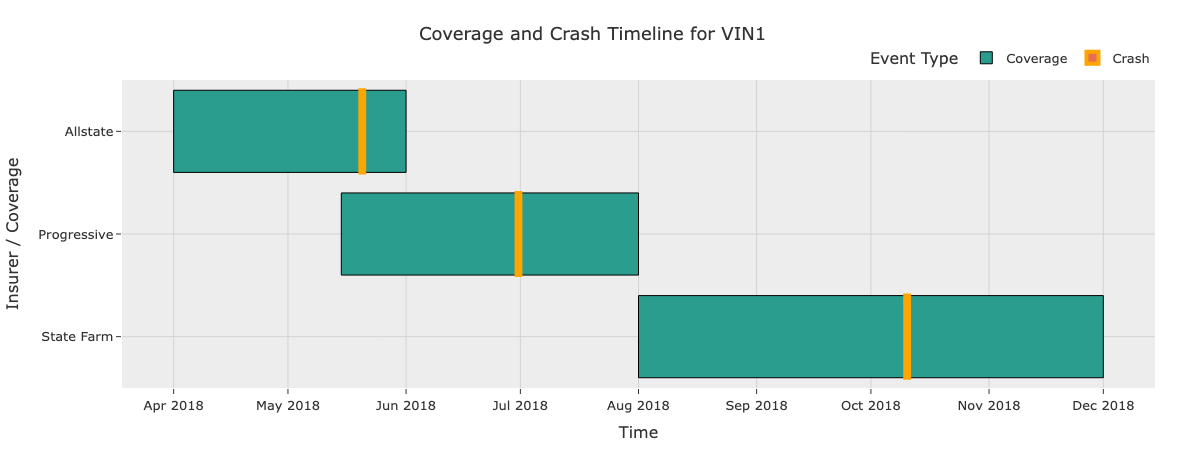
<p>Public crash data typically doesn’t provide official coverage start/end dates. As a workaround, we inferred coverage intervals based on the first and last incident listing a particular insurer for a VIN. If two or more such intervals overlapped (or happened back to back within days), we flagged it.</p>

<p>It’s not ironclad evidence of fraud, but seeing multiple carriers handle the same VIN in a tight window definitely raised some eyebrows.</p>

<p><img src="/assets/blog/insurance_fraud/insurance_swapping.png" alt="Overlapping insurance" />
<em>See the overlap? Frequent insurance switching and coverage starting just days before a crash seems almost premeditated.</em></p>
<hr />

<h2 id="a-deeper-look">A deeper look</h2>

<p><strong>VIN1</strong> caught our eye, so we stepped through the collision history:</p>

<ol>
  <li><strong>Short intervals between reported crashes</strong>
    <ul>
      <li>2018-05-20 (late night collision, property damage, single vehicle)</li>
      <li>2018-06-30 (late night again, minor injury, single vehicle)</li>
      <li>2018-10-10 (early morning, minor injury, single vehicle)</li>
    </ul>
  </li>
  <li><strong>Insurance switching</strong>
    <ul>
      <li>Allstate covered the first incident. Progressive coverage began just before the first crash and ended after the second crash, at which point State Farm took over.</li>
    </ul>
  </li>
  <li><strong>Suspicious environments</strong>
    <ul>
      <li>The collisions happened at times and locations with low traffic and no eyewitnesses.</li>
    </ul>
  </li>
  <li><strong>Single vehicle collisions</strong>
    <ul>
      <li>Each crash was conveniently a single vehicle collision (phantom deer)</li>
    </ul>
  </li>
</ol>

<p>Does this prove fraud? Absolutely not. It might be a string of bad luck, or a driver who’s genuinely error prone. But if I were in claims management, I’d be curious to dig further.</p>

<hr />

<h2 id="why-this-matters">Why this matters</h2>

<p>Fraud is a tricky subject. By some estimates, fraudulent claims cost the industry <a href="https://www.conroysimberg.com/blog/insurance-fraud-costs-the-u-s-308-billion-annually/">billions of dollars each year</a>. We think there’s value in showing how simple VIN analysis, layered with location and insurer data, can highlight <em>“risky”</em> patterns early on.</p>

<ul>
  <li>For insurers and fleet managers: these insights could guide how you allocate resources to Special Investigations Units (SIUs).</li>
  <li>For risk managers: it’s a reminder that <em>where</em> (and <em>when</em>) an accident happens can be as telling as the crash details themselves.</li>
  <li>For us: it’s simply a fascinating look into how raw data can surface unexpected truths.</li>
</ul>

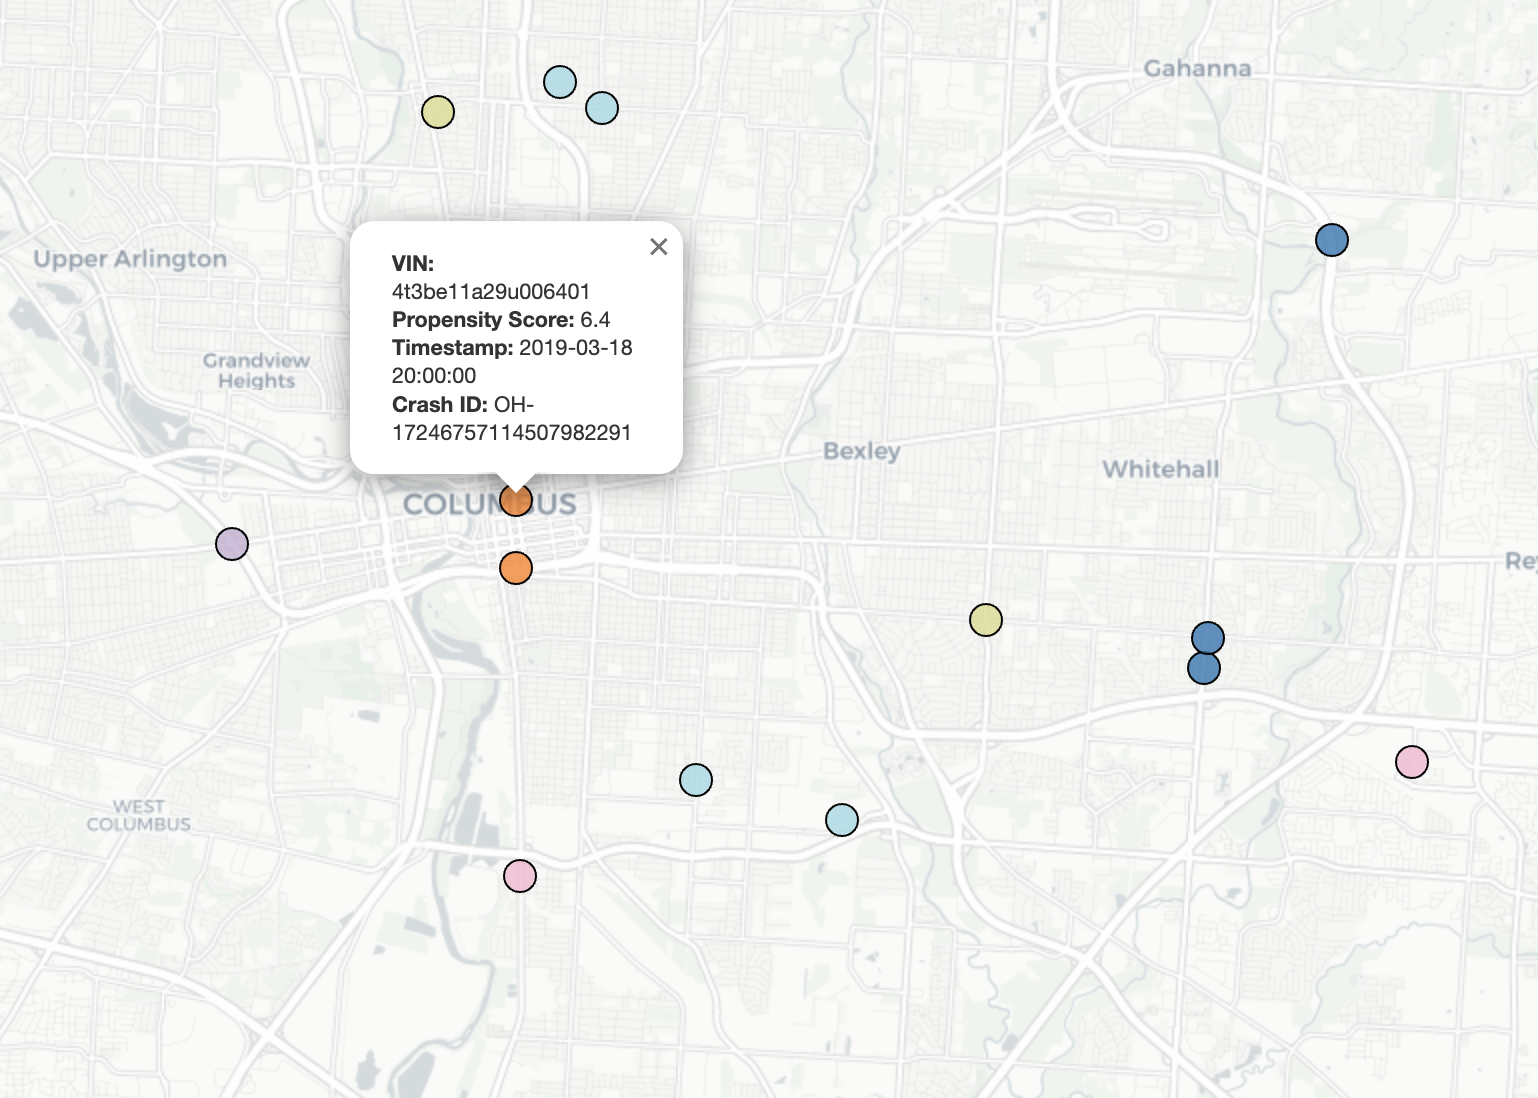
<p><img src="/assets/blog/insurance_fraud/map.png" alt="Crash Map" />
<em>Note: All vehicle and insurance details are <strong>anonymized</strong> for illustration.</em></p>

<hr />

<h3 id="footnotes">Footnotes</h3>

<p>If you’re curious about how we generate our risk scores—or if you just want to compare notes—feel free to <a href="https://www.matrisk.ai/contact?product=crash-data-api">reach out to our team</a>. We’d love to hear your thoughts.</p>]]></content><author><name></name></author><summary type="html"><![CDATA[…]]></summary></entry></feed>